|
Preliminary
Findings
Our
modeling systems have projected increasing demand for forest products
in North America that will be severely dampened by the inability
to supply the raw timber resource in order to meet this demand.
Our analysis indicates future US structural changes in wood use
patterns, rising product prices, and higher profitability for some
producers and timber owners.
Key
Findings
- Past relationships
between the solid wood consuming sectors, such as housing starts,
and key macroeconomic demand drivers, such as GDP, will change
as wood products prices become a significant factor in solid wood
products consumption.
- US softwood
timber harvest will decline significantly over our projection
period due to diminishing resource availability. Hardwood timber
harvests will increase.
- Canadian
timber harvests will reduce, wood products consumption will increase,
and lumber exports to the US will decline.
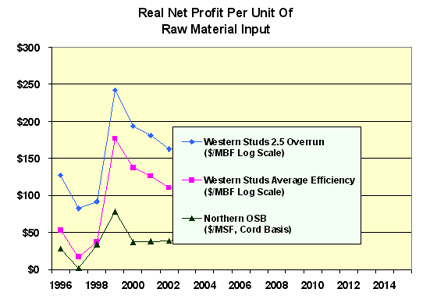
Paper and paperboard producers will experience increased real
costs of virgin fiber input while more efficient solid wood consuming
competitors will find increasing returns per unit of raw material
input.
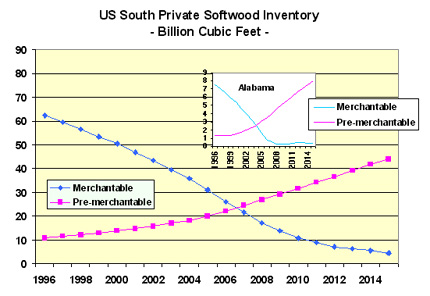
- The US South’s
merchantable softwood timber inventory declines from current levels
to harvesting only merchantable growth. Merchantable hardwood
timber inventory in both “soft” and “hard”
hardwoods will also decline.
Southern pre-merchantable timber inventory will tripple over our
projection; however, this volume is not a significant factor in
explaining stumpage prices.
- Softwood
sawtimber, pulpwood, and wood products prices will increase significantly
in real price during our projection period.
Lumber production will be resource constrained at levels substantially
below current output levels. Softwood plywood production will
Drop to less than one-half current production levels.
Raw material real breakeven margins, calculated at the average
efficiency and not pre-set margins, will reach historical highs.
Efficiency bands for raw material breakeven provide payback and
present value justification for financing capital improvements
Sample
Illustrations
|